

10 Product-Led Growth (PLG) Metrics for Driving SaaS Success: A Comprehensive Guide

In my previous Core Concepts of Product-Led Growth article, I explained the basic concepts of PLG, its history, and made a comparison with sales-led growth.
In short, product-led growth is a go-to-market strategy where all actions and initiatives are focused on the product itself. The product is used to acquire, activate, and retain customers.
Here are the most distinctive features of PLG:
An exceptional product that brings value to its users.
Self-service onboarding of new users.
A freemium model that offers basic product features for free.
Gathering user feedback via multiple channels.
A data-driven approach to product-related decisions.
More and more companies are implementing the PLG approach. Some companies utilize a mix of SLG and PLG, creating a hybrid model.
I also mentioned important PLG metrics, and today I would like to discuss these metrics in depth.
I will divide the metrics into core PLG metrics and supporting PLG metrics, as some of them are more important than others.
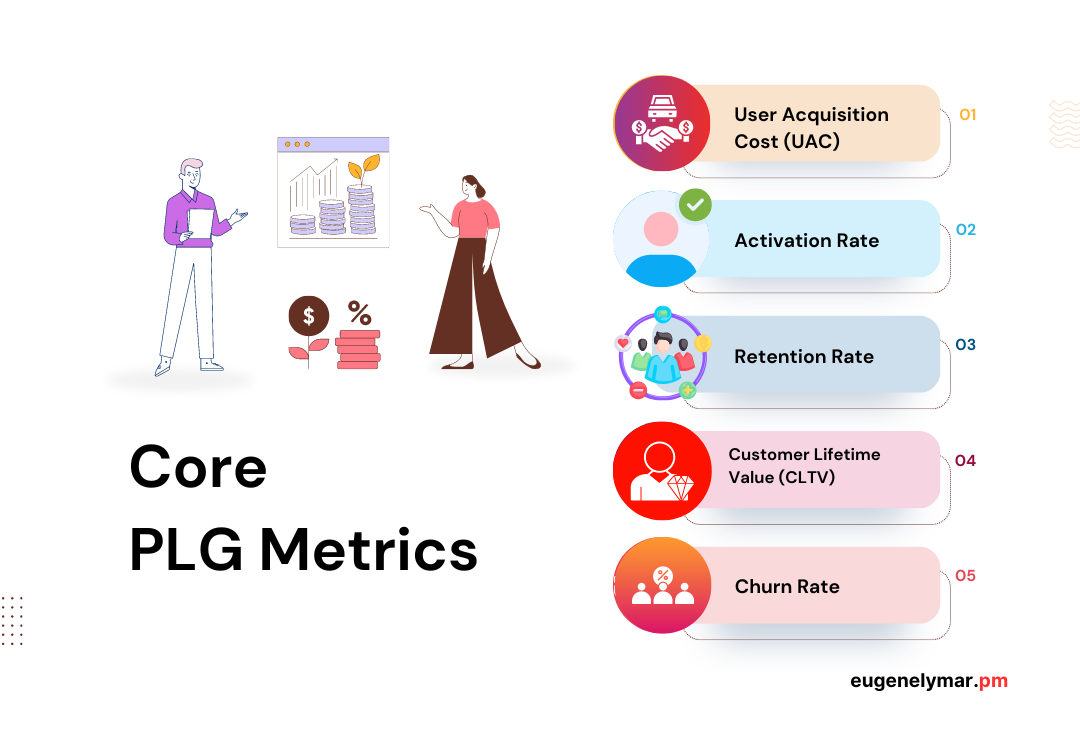
Core PLG Metrics
Here are five most important metrics based for any SaaS product, especially those ones that utilize product-led growth:
User Acquisition Cost (UAC)
Activation Rate
Retention Rate
Customer Lifetime Value (CLTV)
Churn Rate
User Acquisition Cost (UAC)
This metric helps calculate the cost of acquiring a new user. It includes all marketing costs (and sales costs, if applicable) spent to acquire a user. The metric can be calculated for a month, quarter, or year.
UAC = (cost of marketing + cost of sales) / number of new users
A lower UAC is better.
UAC is often compared to LTV (Lifetime Value) to evaluate its effectiveness. A ratio of UAC that is at least 1:2 is considered a healthy ratio.
Activation Rate
The Activation Rate metric is crucial for evaluating the effectiveness of your user onboarding efforts. To do this, you set a specific event, such as writing the first post, and track how many users have completed it.
AR = (number of users who have completed the event / number of signups) * 100
A higher activation rate is better. A low AR indicates problems in your signup/onboarding process which could be due to unclear instructions, poor user experience, or other factors affecting user engagement.
Retention Rate
Retention Rate shows how many users keep using the product after a certain period of time. Good products have high retention rate as users see value and keep coming back.
RR (%) = [(ending users - new users) / beginning users] * 100, where:
new users - number of new users in current period.
beginning users - number of users at start of period.
ending users - number of users at end of period.
The metric is especially important for SaaS products that rely on subscriptions to generate long-term recurring revenue.
The opposite to Retention Rate is Churn Rate.
Churn Rate
Churn Rate is the percentage of users lost during a given period of time. For example, it measures users that have canceled their subscriptions. This is an important metric as it helps to evaluate the overall health of the product.
Low churn rate is generally good, while high or raising churn rate may indicate some product-related problems. The problems may vary from product to product, and must be researched individually.
CR % = (total number of churned users over the period / total number of users at the start of this period) * 100
By tracking the churn rate regularly you can make adjustments to your retention strategies and respond accordingly.
Customer Lifetime Value (CLTV)
The metric is used to determine the total amount of money your product users will spend on your product or service throughout the business relationship. The longer your users keep purchasing product subscription, the better CLTV becomes.
It helps you understand how loyal your customers are, correlates with user churn rate and affects your strategic decision making.
CLTV = customer value * customer lifetime
By analyzing the CLTV metric, you can make better data-driven decisions and use more personalized growth strategies.
Supporting PLG Metrics
The supporting metrics helps you gain additional insights on the product. I have selected five the most relevant and important supporting metrics:
Monthly Recurring Revenue (MRR)
Product Qualified Leads (PQLs)
Net Promoter Score (NPS)
Time to Value (TTV)
Expansion Revenue

Monthly Recurring Revenue (MRR)
Monthly Recurring Revenue is the predictable total revenue generated by your product from all active users during a given month. It is an important metric for subscription-based products.
MRR reflects the overall health of the product and helps you predict future revenue as well as identify growth trends and make strategic decisions.
MRR = number of users * monthly ARPU (Average Monthly Revenue per User)
For example, if you have 24 subscribers who pay $20 per month, the MRR will be 24*20 = $480
Besides MRR, there is also ARR (Annual Recurring Revenue) and QRR (Quarterly Recurring Revenue).
Product Qualified Leads (PQLs)
Product Qualified Leads are users who have used the free trial of freemium version of the product and have demonstrated a genuine interest in its value and potential. Such users are important as they may become paying customers.
PQLs align well with the PLG approach, where the product itself is a key driver of user acquisition and growth.
PQL % = (number of PQLs / total number of leads) * 100
Companies use the PQL metric to focus their marketing and sales efforts more efficiently, improve customer engagement and improve the product or its strategy.
Net Promoter Score (NPS)
The metric measures the loyalty of users/customers to the product or company. Usually it is measured by a single survey where a user must set a score from 0 to 10 (with variations).
For example:
“On a scale of 0-10, how likely is it that you would recommend the product to your friends or business associates?”
Those who give a low score (1-5) are called detractors, and those, who give a high score (8-10) - promoters.
The higher score is, the better.
NPS = % promoters - % detractors
Expansion Revenue
Expansion Revenue is the additional revenue generated by your existing customers (upsells, cross-sells, add-ons). There might be Monthly Recurring Expansion Revenue or Yearly Recurring Expansion Revenue.
The goal in calculating expansion revenue is to accurately track upsells, cross-sells, and add-ons to see if your business is growing.
Expansion Revenue % = (recurring revenue at the end of the month - start of the month (for the same customers)) / recurring revenue at the start of the month * 100
How to Prioritize PLG Metrics
Prioritizing PLG metrics depends greatly on the growth stage of your product. Those metrics that are important on the early stage, might be less important on later stages.
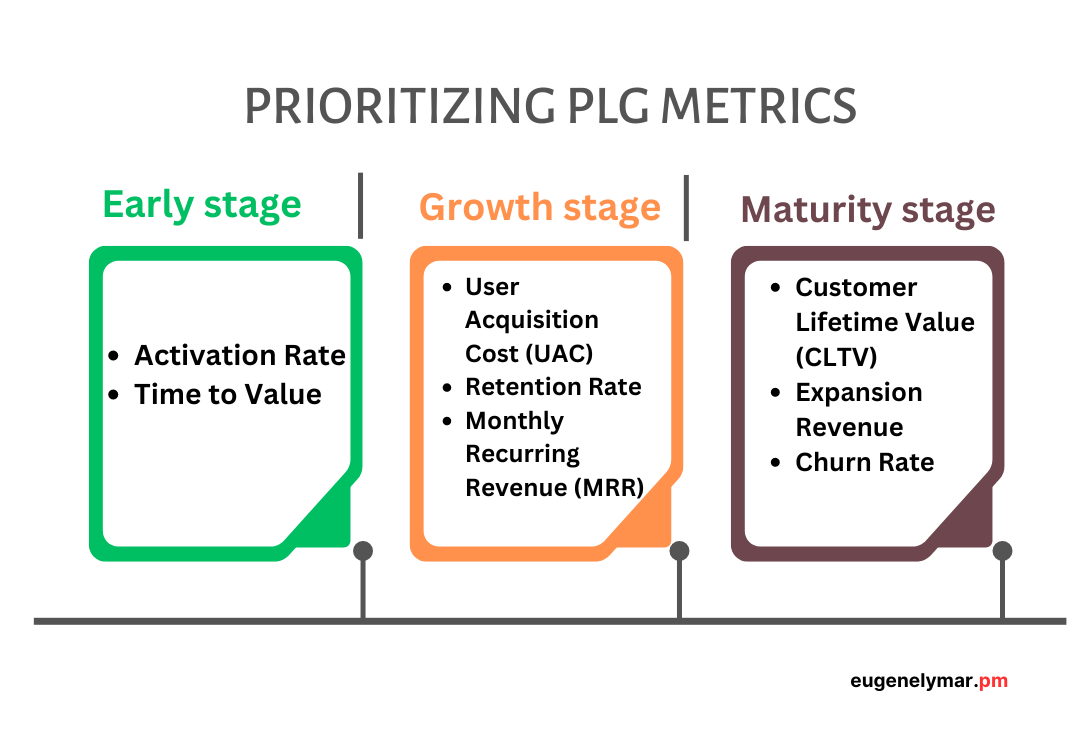
In the early stage, when you define product-to-market fit:
Activation Rate
Time to Value
At this stage your goal is to ensure that users experience the value of your product fast enough and that you are attracting the right kind of users. High Activation Rate indicates that you have set an efficient onboarding process, while a short TTV suggests that users are recognizing the product’s value promptly.
In the growth stage, when you scale up your user base:
User Acquisition Cost (UAC)
Retention Rate
Monthly Recurring Revenue (MRR)
As your user base starts to grow, it is crucial to maintain the affordable UAC, and at the same time focusing efforts on retaining existing users. Retention Rate ensures that your growth is sustainable, while MRR provides a clear picture of revenue stability and growth.
In the maturity stage, when you maximize product revenue:
Customer Lifetime Value (CLTV)
Expansion Revenue
Churn Rate
In this stage you focus on maximising revenue from the existing customers. By making upsells and cross-sells you improve the CLTV metric, and at the same time try to minimize Churn Rate in order to keep a stable customer base. Expansion Revenue is also a key metric as it directly correlates with your ability to grow revenue from your existing customer base.
Conclusion
In the PLG world product metrics are the foundation that keeps you informed about the health of your product helping you to make correct business decisions. Both core and supporting metrics help companies to acquire new users and retain the existing ones while focusing on maximizing product revenue.
Understanding and prioritizing the right PLG metrics is key to driving growth and ensuring long-term success.
By regularly tracking and analyzing these metrics, you can make data-driven decisions aligned with your company’s goals, improve user experiences, and ultimately, create a product that not only attracts users but keeps them coming back for more.
Please subscribe to support my work. If you have any questions, connect with me using: